|
||||||||||||||||||||||||||||||||||||||||||||||||||||||||
Fisheries :: Introduction |
||||||||||||||||||||||||||||||||||||||||||||||||||||||||
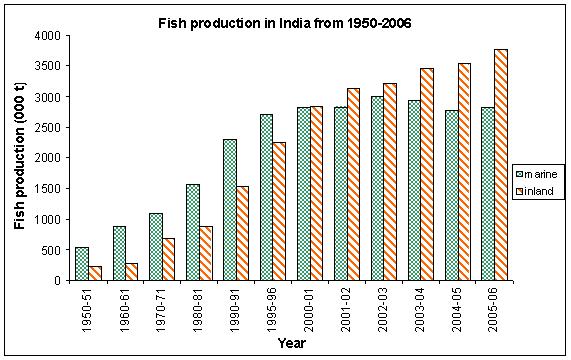
Introduction Fishes make up most of the abundant class of vertebrates, both in terms of number of species and of individuals. They exhibit enormous diversity of size, shape and biology, and in the habitats they occupy. Nelson (1984) estimated 21, 723 extant species of fish under 4,044 genera, 445 families and 50 Orders in the world, compared to 21,450 extant tetrapods. Other researchers, have arrived at different estimates, most of which range between 17,000 and 30,000 for the numbers of currently recognized fish species. The eventual number of living fish species may be close to 28,000 in the world. Day (1889) described 1418 species of fish under 342 genera from the British India. Jayaram (1981) listed 742 freshwater species of fishes under 233 genera, 64 families and 16 orders from the Indian region. Talwar (1991) estimated 2546 species of fish belonging to 969 genera, 254 families and 40 orders. The Indian fish population represent 11.72% of species, 23.96% of genera, 57% of families and 80% of the global fishes. The fish fauna of the major tropical regions, Southern Asia, Africa, South and Central America are generally different with respect to genera; but, some families have members in two or all of the continents. In Southern Asia the predominant fish groups are the carps (Cyprinidae) and the cat fishes (Siluroidea) (Berra, 1981). Fish production in India has increased at a higher rate compared to food grains, milk, eggs and other food items. India ranks second in the world fish production with an annual fish production of about 6.9 million metric tonnes. Fisheries sector contributed Rs. 34,758 crores to the GDP during 2005-06, which was 1.2% of the national GDP and to 5.3% of the agricultural GDP. However, the share of fisheries sector in the State Domestic product was estimated to be 1.44% in 2005-06. There has been a gradual shift (as shown in the figure below) in the production scenario from marine to inland fisheries in recent years.
(Source: Economic Survey, 2007 and ICAR, 2006 and www.vuatkerala.org) | ||||||||||||||||||||||||||||||||||||||||||||||||||||||||
© All Rights Reserved. TNAU 2009-15. |
||||||||||||||||||||||||||||||||||||||||||||||||||||||||